
In this chapter we deal with tools, that help you anticipate future price movements. There are many types of chart indicators, we will discuss the most common ones here. In practice, however, we advise you, that you specialize in one to a maximum of three indicators, more confuse only.
Bollinger Bands
Bollinger bands are used to measure volatility. Basically, this tool tells us whether it is quiet on the market or whether it goes right to the point. In the case of very small price movements, the two lines are (Bands) close to each other, with strong movements, the distance between the lines increases.
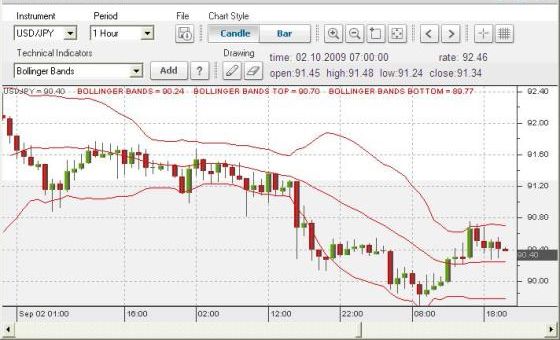
In the chart you can see, when the price has moved at the same level, the two lines were relatively close together. When the price dropped, you have distanced yourself from each other.
Instead of explaining how Bollinger bands are calculated, we prefer to show you a few ways you can use them when trading.
Bollinger Bounce
One things you should know about Bollinger bands, the price always tends to move to the middle of the two lines. This is the idea behind the Bollinger Bounce.
If that's the case, view the chart section below. Where do you think the price will move next??
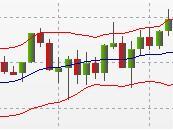
You guessed it, since the price was on the upper line, the probability that it would move down again was very high.
Our example is a typical Bollinger Bounce situation. Bollinger Bounces behave like mini Support and Resistance Levls. The longer your time frame is used, the stronger these lines are. Bollinger Boncees can then be used well, if no clear trend is visible.
So next, learn how to use Bollinger bands well in volatile markets.
Bollinger Squeeze
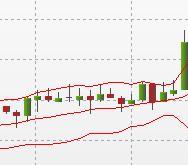
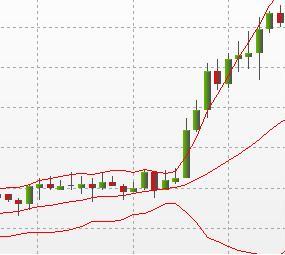
The Bollinger Squeeze is actually self-explanatory. When the lines compress, this usually means, that a price breakout may occur. When the candles start to tear out over the top line, then this is likely to result in an upward movement. Start to swing the candles down sharply, there will probably be a downward movement.
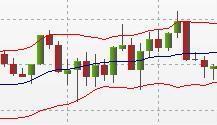
Look at the chart, then you can see that the lines are squeezing. The price has just started to swing over the top line. Where do you think the price will move?
Exactly right, the price will rise. How a typical Bollinger Squeeze works. This strategy has been developed so that you can detect a price movement as early as possible. You cannot use Bollinger Sqeezes daily, but a few times a week the right conditions occur, for this you use from the best a 15 Minutes Chart.
Now you know what Bollinger bands are, and also how you can use them. Of course, there are many more ways to work with Bollinger tapes, but these two strategies are the most common.
MACD
Moving Average Convergence Divergence, MACD for short, is a tool to identify trends with the help of moving averages, no matter if bulls- or bear trend. Recognizing a trend should always be the highest priority when trading FOREX, because that's where the most money is made.
How MACD is created
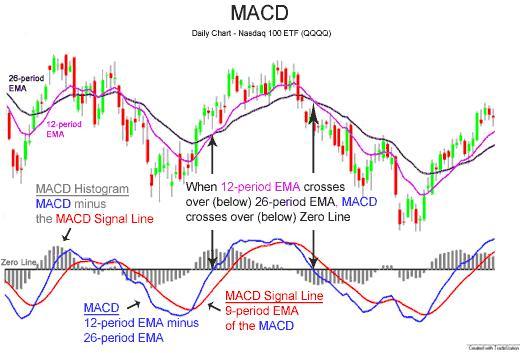
As you can see on our chart, a MACD consists of two lines and a histogram.
- The MACD Line (blue line) is calculated by a fast mean value (e.B. with 9 Calculation periods) from a slower mean (e.B. with 26 Periods) is deducted.
- The MACD signal line (red line) is the average of the MACD line.
- The histogram is created when the signal line is subtracted from the MACD line.
If you think in this chart what is missing, then of course we agree with you, here the histogram is omitted from the MACD.
Using the MACD
Now you know how to create a MACD. Next, we will see how you can use the MACD as a tool when trading.
The MACD is a so-called “Trend following Indicator”, so it works best when trends are present. For sideways trends, MACD's like to give misleading signals.
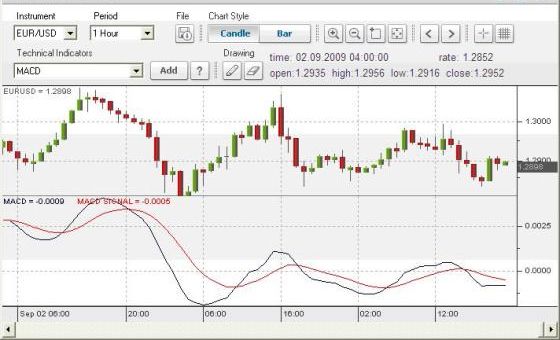
MACD Crossover
Crosses the MACD (blue) its signal line (red) from bottom to top, a buy signal is created. On the other hand, traversing from top to bottom is interpreted as a sell signal. The further the MACD moves away from its centerline, the stronger a trend is. But you should remember, if the distance becomes too large, the market may be overbought or oversold, a trend change is the logical consequence.
The distance between the MACD and its signal line is an indicator of the strength of a trend. The further the MACD moves away from the line, the stronger the trend, because the faster moving average increases faster than the slow moving average.
MACD's have a disadvantage. Moving averages always lag behind the price, since they are always averages of past prices. The MACD is created from different moving averages and is then smoothed again by a moving average, you can certainly imagine that a delay occurs. Nevertheless, the MACD is the most popular tool among many traders.
Parabolic SAR
So far, we have dealt with indicators, that let us see the beginning of a trend. Although it is important, that we are able to identify new trends, but it is also at least equally important to recognize when a trend ends. What good is the right time to start, if we don't know when we have to close again.
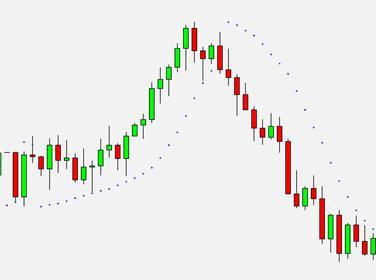
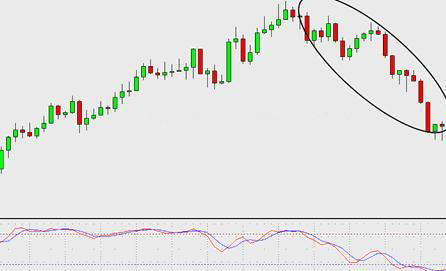
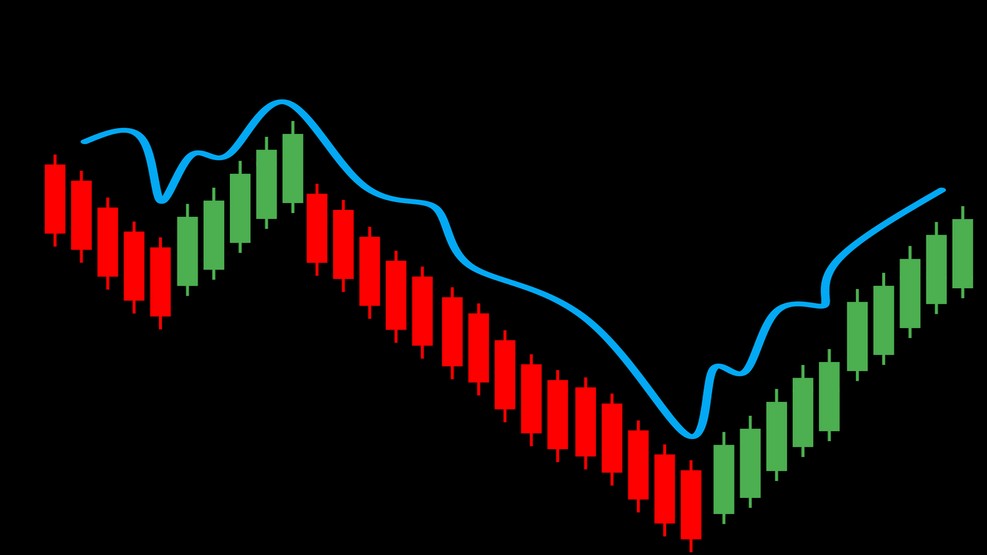
An indicator that helps us find out where a trend is likely to end is the Parabolic SAR (Stop And Reversal). A parabolic SAR draws points on the chart, which indicate possible reversals of price movements. On the chart you can see, that the points are below the candles during the uptrend and jump over the candles when switching to the downtrend.
Use of Parabolic SAR
The great thing about parabolic SAR's is that they are easy to use. Fundamental, if the points are below the candles, is this a buy signal. Are the points above the candles, it is a signal to sell. This is probably the indicator easiest to interpret, since it is displayed whether the price degree rises or falls. This tool works best, if longer on- and downward trends are present. You should not use Parabolic SAR's, when the market is in sideways movements.
Stochastic Oscillator
Stochastic oscillators are other indicators that help us to recognize when a trend is likely to end. Stochastic oscillators measure overbought or overbought. oversold conditions prevail on the market. The two lines are comparable to those of a MACD in terms of, that one line reacts faster than the other.
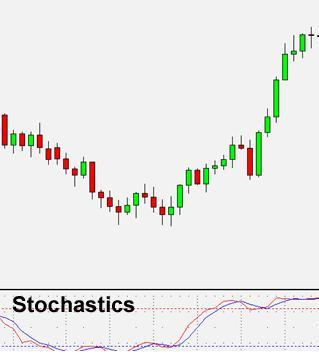
How can I use stochastic oscillators?
As already mentioned, tell us stochastics if the market is overbought or oversold. Stochastics are performed on a scale of 0 until 100 valued. If the Stochastic lines overlap 70 move (the red dotted line in the chart), this means that the market is overbought. On the other hand, do the stochastic lines fall under 30 (the blue dotted line in the chart), this means that the market is oversold.
As a rule of thumb, we remember:
We buy when the market oversells and sell when the market is overbought.
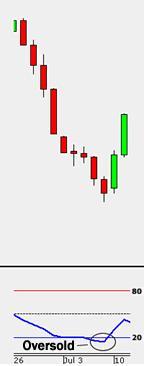
View the chart, the stochastics have been showing overbought conditions for a long time. If this is true, where do you think the price will move next?
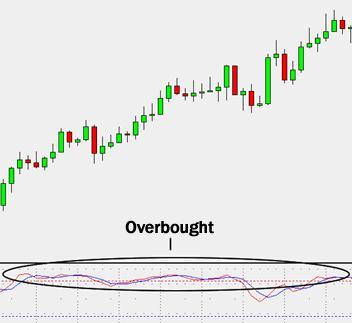
You're right, of course, the price we fall. The market was overbought for an extended period of time, a trend change is very likely.
This is the basic information about stochastic oscillators. Many traders use them in different ways, but the main task of this indicator is to show us whether the market is overbought or oversold. Over time, you will learn to use stochastic oscillators in this way, that they fit your personal trading style.
Relative Strength Index
The Relative Strength Index, short RSI, like the stochastic oscillator, it is an indicator of overbought or oversold conditions in the market. The RSI is also on a Scala of 0 until 100 measured. Values under 20 show us oversold conditions, while we use values above 80 can assume overbought conditions.
Using RSI
RSI can be used in the same way as Stochastics. In the chart you can see, than the RSI under 20 fell, he showed an oversold market. After the low point, the price has risen again.
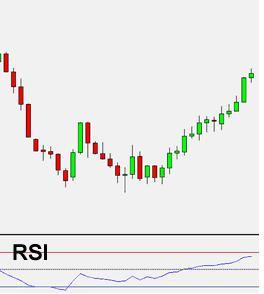
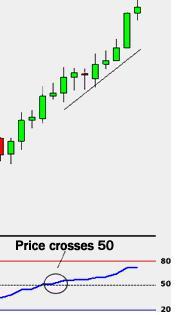
The RSI is a popular tool, since you can also use it to confirm a trend. If you think a trend is forming, take a quick look at the RSI and find out if it is above or below 50 lies. When you look at a possible uptrend, then make sure that the RSI is above 50 lies. For a possible downward trend, if the RSI should be below 50 condition.
At the beginning of our chart we can see a possible upward trend. To avoid error, we can wait until the RSI exceeds the 50 line to confirm the trend. So we have a relatively reliable confirmation that a trend is really developing.
Use of multiple indicators
In a perfect world, we could use our favorite chart indicator and trade exactly what this indicator tells us. The problem is, that we don't live in a perfect world and that every indicator has its weaknesses. This is the reason why many traders use multiple indicators, so that they confirm each other. For example, you can use three different indicators and only then trade, if all three agree in their statement.
Test the different indicators, and find out which ones work best for you (of course, you only do these tests with a demo account and never with real money). We like to use MACD, Stochastic oscillators and RSI together, but maybe you prefer a different combination. Every trader out there tries the “magical combination” of indicators to be found, which always gives him the right signals, but the truth is, unfortunately this combination does not exist.
We recommend that you study each indicator individually, until you know exactly how they react to price movements. After that, you can choose a combination of indicators, that suits your trading style. In one of the next chapters we will also describe a system, which uses various indicators, we would like to show you how they can complement each other.
Summary of chart indicators
Every detail you need about FOREX- Learning to trade is like a tool you can put in your toolbox. These tools make it easier for you to work at FOREX- Trade.
Bollinger Bands
- Used to measure the volatility of a market.
- They behave like small support and resistance levels.
Bollinger Bounce
- A strategy based on observation, that the price always moves back to the middle of the two lines.
- You buy when the price touches the lower line.
- You sell when the price touches the top line.
- Best to use when there is no clear trend on the market.
Bollinger Squeeze
- A strategy that is used to detect early outliers of the price.
- When the two lines narrow, this means that it is very quiet on the market, an uproot is very likely. When the course starts to turn off, we make our order, in the direction in which the price has started to swing.
MACD
- Used to identify trends early and show us when a trend reversal can occur.
- Consist of two moving averages (a fast and a slow reacting) and a histogram, that measures the difference between the two means.
- Contrary to what most people think, the two moving average lines are not the moving averages of the price, but the mean of another moving average.
- The big disadvantage of MACD's is the use of multiple moving averages, which can lead to sometimes severe delays.
- One way to use MACD's is, to wait until the fast line cuts the slower line. Here we can open our trade, as this indicates a new trend.
Parabolic SAR
- This tool is there to show us a trend change, what the name already tells us Stop And Reversal (SAR).
- It is the easiest indicator to interpret, because a SAR only shows us whether a price rises or falls.
- Are the points above the candles, this is a signal to sell.
- Are the points below the candles, if it is a buy signal.
- Are best used when long periods of on- and downward trends are present.
Stochastic Oscillators
- Used to detect overbought and oversold market conditions.
- Are the Moving Average lines over 70, means the market is overbought and we should remember to sell.
- If the moving average lines fall below 30, the market is oversold and it might be wise to buy.
Relative Strength Index (RSI)
- Like the Stochastic Indicator, time and also the RSI overbought and oversold conditions.
- Is the RSI over 80, the market is overbought, so we should sell.
- If the RSI drops below 20, this means that the market is oversold and we should buy.
- The RSI is also useful to confirm a possible trend. If you believe, that a trend develops wait until the RSI over 50 rises or falls below 50 Decreases (depending on whether you have a- or expect a downward trend) before you open the trade.
Each indicator has its weaknesses, that's why most traders use multiple indicators at the same time to hedge. On your way to becoming a successful FOREX trader, you will find out which indicators you prefer to work with. You can combine them in this way, that you fit your personal trading style.
The topic of chart indicators is very extensive, but you should be sure that you have understood everything. It is sometimes necessary to read through a topic more than once to recognize the connections. When you understand everything, log in to your demo account and play in different charts. Find out how the different indicators react to price movements.
In a further step, you can try to combine the different indicators and try to guess as accurately as possible where the price will move next.. The higher your hit probability is, the more successful your future trades will be. But don't get discouraged if your forecast doesn't happen every time, even experienced traders sometimes get it wrong.
- Best Forex MT4 & MT5 Indicators

- Best Trading Strategies
- Kaufman Bands

- Bollinger Squeeze mit MACD Indikator

- Bollinger vs Envelopes

- Trend Tapes

- William %R Histogramm mit Alarm

- Bollinger Bands Indicator

- Combinations of Japanese candles

- Bollinger Bands Reversal Binary…

- Bollinger Bands (BB) Indikator
 Indikator")
- Daily Forex Signals with Alarm

- Profitable Bollinger Bands…

- BBands Stop mit Alarm

- Four Bollinger Bands Scalping…

- DJ Lines

- Sigma Tapes

- Bollinger Bands Breakout Binary…

- Fast Rsi Bollinger Bands Trading System

- Stochastic Bollinger Bands Indikator

- Cci Reversal Bollinger Bands…

- Breakout Bollinger Bands Trading System
