
Professional traders and brokers use pivot points to identify key support and resistance levels. Pivot point would be another word for pivot (Pivot Point), on a FOREX chart it is a price level around which the prices have moved in a certain period of time. Put simply, pivots and the associated support and resistance levels are, Areas where the direction of a price movement may change.
Pivots are especially helpful for short-term traders (Traders who trade in very short periods of time), who try to profit from very small price movements.
Pivots can be helpful for both rank-bound traders and breakout traders (what rank-bound and breakout traders are we explain to you in a moment). Rank-Bound Traders Use Pivot Points to Find Reversal Points. Breakout traders use pivots to identify important price levels that need to be reached, so that the movement as an outbreak (Breakout) can be used. As I said before,, more details will follow shortly.
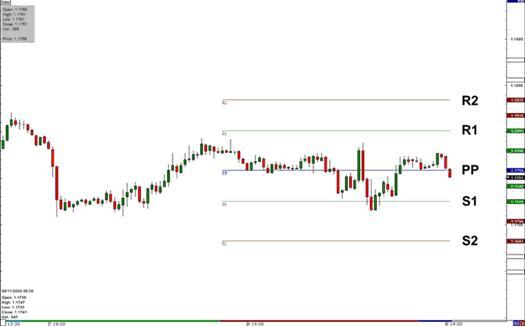
In this example, A 1 Hours EUR/USD chart became pivot point (PP) and Support and Resistance Levels 1 and 2 Displayed.
How are pivot points calculated??
The pivot and the associated support and resistance levels are adjusted with the help of opening, Maximum, Lowest and closing price of the last trading section calculated. Since FOREX is a 24-hour market, you can choose the time at which you accept the closing price of the previous day yourself. Our proposal, always use the same time, e.B. Closing time of one of the major stock exchanges.
the calculation of the pivot then proceeds as follows:
Pivot Point (PP) = (Höch + Low + Final price) / 3
Starting from the pivot point, the different support and resistance levels are calculated as follows.
Support and Resistance Level 1:
First Support (S1) = (2xPP) – Maximum price
First Resistance (R1) = (2xPP) – Lowest price
Support and Resistance Level 2:
Second Support (S2) = PP – (Most – Lowest price)
Second Resistance (R2) = PP + (Most – Lowest price)
These formulas should only be mentioned in passing., You don't have to memorize them or calculate them yourself when trading. Your trading platform performs these calculations for you and displays the result on your chart.
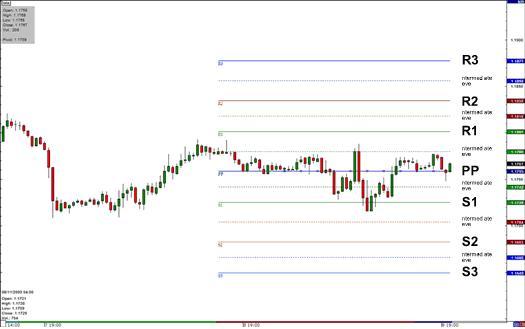
Also keep in mind that some brokers have additional pivot point features such as. a third support and resistance level or between levels (Level between the pivot and the main support and resistance levels) offer. These additional levels are not as crucial as the first ones 5, but it can't hurt to watch them either..
Trading with Pivot Points
Now that we know how to calculate pivot points, we want to find out how we as FOREX traders can use them for our purposes. There are basically two types of traders, which pivot points use. On the one hand these are breakout traders and on the other hand the rank-bound traders.
Breakout Trader – Pivot Points
The pivot point should come first if you are looking for a good time to start, as this is your main support and resistance level. The largest price movements usually occur around the pivot point.
Only when the price reaches the pivot are you able to determine whether you have a long- or open a short position and where your profit target and stops lie. Fundamental, Prices above the pivot we consider this to be bullish, they are bearish below. Let's say the price moves around the pivot and closes below, then you would opt for a short position (Sale) decide. Your stop loss would be above the PP and the profit target would be at S1. Notice that the price below S1 continues to fall, then you can set your existing stop-loss order just above S1 and observe it closely. S2 is believed to be the lowest point of the trading day and should be your best profit target.
The opposite is true during an upward trend. If the price closes above PP, you would open a long position, Define stop loss under PP and R1 or, in the better case, R2 as profit targets.
Rank-Bound Trader – Pivot Points
The strength of support and resistance at the different pivot level is determined by the number of touches of the pivot level. The more often a currency pair touches and reverses a pivot level, the stronger this level is. Pivoting means simplified, after reaching a support or resistance level comes a reversal.
Is the price approaching a higher resistance level, then you can sell the pair, however, you set a tight safety stop above this resistance level. Does the price continue to rise and break the resistance level, we call this an upward breakout. Your short order would have to close, but if you think the outbreak will be strong, you can enter again with a long position. To be on the safe side, you would then place a stop-loss order just below the resistance level., which has just been breached and has now become support, place.
Is the price approaching a lower support level, you can buy the pair and define a stop-loss order below the support level.
Theoretically perfect?
In theory, it all sounds very simple.. In real trading, pivot points don't always work as we would like them to.. Prices have the habit of staying close to the pivot and often it is very difficult to see what he will do next.
Sometimes the price stops just before it reaches a pivot level and changes direction, which means that your profit goal will never be achieved. Another time, it looks like the pivot line is a strong support level, that's why you open a long position, just to see that the price is falling after all, It stops and then moves back in your direction. You should be very picky and develop a pivot point trading strategy that you then stick to..
Let's look at the chart below to see how complicated or simple pivot points can be.
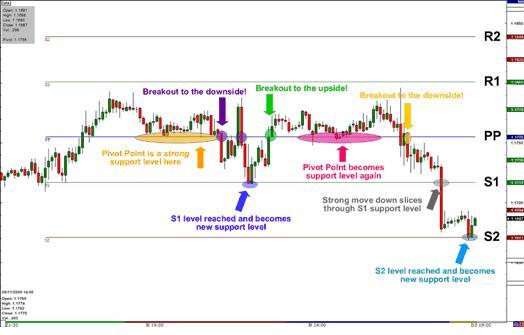
Look at the orange highlighted area. Who buys here at PP, must realize that the price never reaches R1. At the first violet circle, the price falls below PP, but cannot touch S1 and then rises back to PP. At the second breakthrough downwards (second violet circle), can reach the pair S1 before it rises again.
In the section marked in pink, PP is again a strong support level, but the price can never rise to R1. At the yellow dot, the pair breaks down again to S1 and then even makes it to S2.
If you had bet on a long position on this chart, you would have been stopped every time. Personally, I would never have thought of opening a long position here, however, we know something that you do not know in this example. The price has been trending downwards for a long time.
Remember “The trend is your friend”, and we don't want to stab a friend in the back. We will never try to act against the trend.
Pivot Point Trading Tips
Here are some easy-to-remember tips, that help you make smart decisions when trading with Pivot Points.
- Is the price at PP, let's wait for a movement back to R1 or S1.
- Is the price at R1, expect a movement to R2 or back to PP.
- Is the price at S1, expect a movement to S2 or back to PP.
- Is the price at R2, expect a movement to R3 or back to R1.
- Is the price at S2, expect a movement to S3 or back to S1.
- When there is no important news affecting the market, the price will usually always move from PP to S1 or R2.
- Is there any important news that affects the market?, if the price moves past S1 or R1 to S2 or R2 and maybe even S3 or R3.
- R3 and S3 are good indicators of maximum range on extremely volatile days, sometimes even these can be exceeded.
- Pivot lines work well on sideways movements in the market when the price is between R1 and S1 most of the time.
- During a strong trend, the price breaks through the pivot lines and keeps the direction.
Point Pivot Summary
- Pivot Points is a technique used by professional traders and brokers to- and find out exit points. It is based on the market activities of the past trading day. This technique works best when a trend has been detected.
- Pivots are often very helpful in FOREX trading, as many currency pairs usually fluctuate between these levels.
- Rank-bound traders open a long position near detected support levels and a short position when the pair approaches a resistance level.
- Pivots also allow breakout traders to find out important levels that need to be broken in order to avoid a real breakout.
- The simplicity of pivot points make them a helpful tool for your trading toolbox. This tool allows you to, identify possible areas, from which a price movement can emerge.
- Learn to use Pivot Points together with my other technical analysis tools, such as.B. Candlestick Pattern, MACD Crossover, Moving Average Crossover or Stochastics Overbought/Sold Level. The more matches, the greater your chances of winning.
- Best Forex MT4 & MT5 Indicators

- Best Trading Strategies
- Waddah Attar Strong Level Indicator

- Swing Point Indikator

- Gmma Short Indicator

- Guppy Long & Short

- Psycho Level Support Resistance…

- Mtn Support Resistance Binary…

- Support Resistance Levels Indikator

- Pivot with Mid Levels Indicator

- Two Points Resistance Trading System

- Support Resistance Indicator

- 3 Level ZZ Semafor Indicator

- Levels Trend Pivot Points…

- Indicator Sensor Level

- Ema Levels Indicator

- Support and Resistance Indicator

- Srt Support Resistance Trading System

- Waddah Attar Super Support…

- Daily Pivot Points Indicator

- Fractal Level Xrust Indicator

- Price Action Support Resistance…
