Support (Support) and Resistance (Resistance) is one of the most widely used concepts of FOREX chart analysis. The stranger it seems, that everyone has a different idea of it, when support or resistance occurs. Let's look at a diagram in which both situations are drawn.
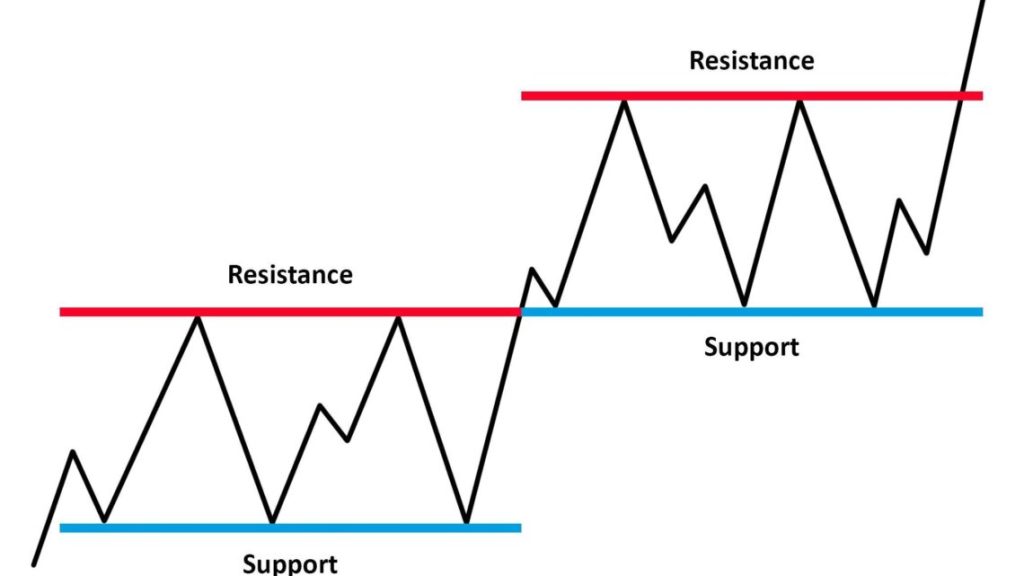
In this chart we see that the price is basically in an upward trend (Bull market) is located, but there is also a tick – Zack patterns to recognize. When the price rises and then is pulled down, then we refer to the highest point previously reached as Resistance.
Does the price start to rise again, the support is at its lowest point before it goes up again. In this way, resistance and support are repeated over a longer period of time. Of course, the same can be done in the event of a downward trend. (Bear market) enter.
We should remember this, that the support and resistance level is not expressed in an exact number. Very often you will recognize a support or resistance level, but a short time later you realize that the market has only made one attempt. In the case of candlesticks, these attempts at support and resistance can be recognized by the shadows.
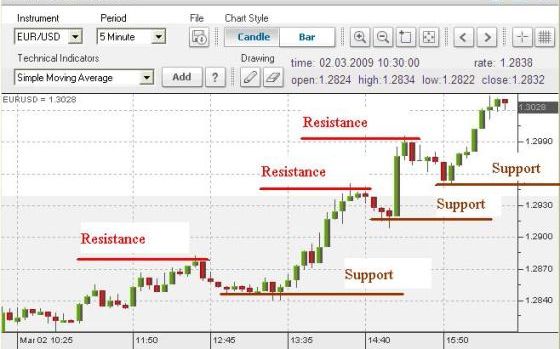
On the right side of the diagram you can see how the shadows of the candles test the resistance level. It looks like the market has reached a resistance level, but there is no clear direction after that is not recognizable for the time being.
After that, several support and resistance zones are clearly recognizable. These zones work, because they can be recognized even by inexperienced traders. Investment bankers and even central banks base their trades on these zones. This raises the question, how experienced traders deal with support and resistance. A bull trend can be clearly seen in our chart. In between, however, there were always minor downward corrections.
One way to make support and resistance zones easier to detect is, that you use line charts instead of candlesticks. The reason for this is that, that line charts mur show the final prices, while candlesticks additionally maximum- and show lowest prices. This maximum- or. Lowest prices are often misleading, because these often only “Vagaries” of the market are. It's like someone doing something very extraordinary, Ask you about it, and he gives you as an answer. “I'm sorry, that was just a reflex.”
When you mark Support and Resistance, then you don't want the reflexes of the market. They just want the expected movement.
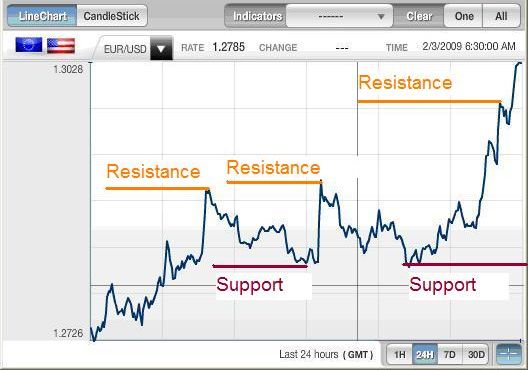
When viewing the line chart, drag your support and resistance lines around zones, where the price reveals peaks or valleys.
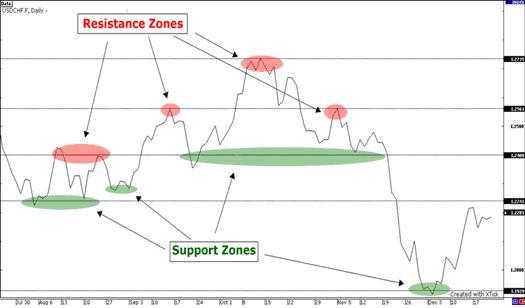
Should the market pass by the resistance, this is how this resistance becomes a support. The more open the price tests the level of resistance or support without a subsequent change of direction, the stronger the zone of support or resistance becomes.
Trend lines
Trend lines are probably the most popular form of technical analysis and are probably the most widely used. If they are drawn correctly, they are just as meaningful as any other method. In fact, most traders do not draw trend lines properly or try to adjust the market to the line, instead of vice versa.
How to draw trend lines?
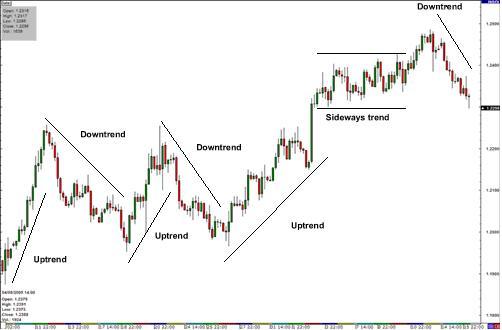
By definition, in an upward trend, both high- as well as low prices on the rise. This can be easily illustrated by a trend line in the chart. There are no fixed rules on how to draw a trend line. However, many retailers have agreed on this, that only those candles are used for trend lines, where two candles to the left and right of each have a higher lowest point than the candle, to which the trend line is connected.
In an upward trend, the low points are always connected, in a downward trend always the high points.
Channels
If we take the theory of trend lines a little further and in parallel a line at the angle of the upwards- or pull downtrends, we get a channel.
To draw an up channel, simply drag a parallel line to the trendline and then move it there, where you touch the highest points. You should draw this at the same time as the trend line.
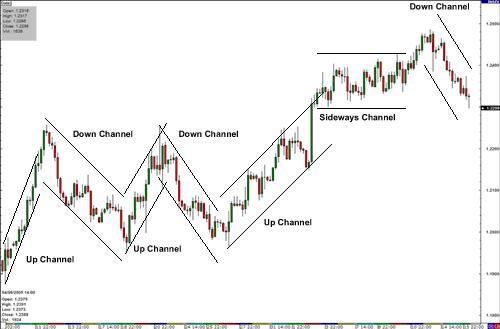
When the price touches the bottom trend line, this can be a good time to buy. Inverse, the price should touch the upper trend line, then this could be a convenient time to sell.
- Best Forex MT4 & MT5 Indicators

- Best Trading Strategies
- Forex Reversal Indicator

- Forex Activa Indicator

- Forex SunRise

- Fractal Support Resistance Indicator

- Grid Support Resistance Trading System

- Supply Demand Index Support…

- Hedging Forex EA

- Price Alarm Indicator

- Forex Turbo Scalper

- Support and Resistance Barry Indicator

- Power Dynamite Areas Support…

- Forex SSG Trading System

- Dynamic Support and Resistance

- Harmonic Pattern Indicator

- Forex Channel Indicators

- Murrey Math Support Resistance…

- Forex Impuls Trend Indikator

- MTF Resistance Support Indicator

- Support Resistance Indicator

- Forex 96 Indikator
