
One of the most fundamental decisions for a trader, is the choice of time frame. What I want to say is, You should plan to keep your positions open over how long you plan to keep your positions open. This time span can range from a few seconds to several months. A too small time window is often not manageable for the beginner, but especially beginners often do not have the necessary patience to trade in a larger time frame.
In which time frame should I trade??
One of the main reasons why it doesn't work the way it's supposed to work for many traders is because you're in the wrong time frame. (Time frame) act for your personality. New traders want to learn how to get rich quick, so start with very small time frames (1- or 5-minute charts) work. What follows is frustration, because that's the wrong time frame and doesn't fit your personality.
In the end, when we have tried several time frames, we find that we feel most comfortable with a 1-hour chart. This time frame is longer, but not for too long and we won't be flooded with trading signals as much, but it still won't get boring. We now have more time to analyze the market and don't feel overwhelmed.
On the other hand, we have a friend who could never trade on a 1-hour chart. It would be way too slow for him and he feels like he is going to die and rot first before he can open a trade. This friend prefers a 10-minute chart. That still gives Him enough time (but not too much) decisions, based on his trading plan, to meet.
But there are also those who cannot understand, how someone can work with a 1-hour chart, 'Cause they think it's too fast. These people only trade in daily, Weekly and Monthly Charts. One of those guys is called Warren Buffet, I'm sure you've heard of him.
Now you may be wondering which is the right time frame for you. If you've been paying close attention, you already know the answer. Choosing the Right Time Frame Depends on Your Personality. You need to be comfortable with the time frame you are trading with.
You will always feel a little tense or even under pressure as real money is at stake. However, you should not feel this pressure because everything is too fast for you to make decisions or too slowly because it can lead to frustration.
When you start trading, try to figure out which is the right time frame. It's best to start with a 15-minute chart, then a 5-minute and then a 1-hour chart. But also try daily and 4-hour charts.
Time frames are usually divided into three categories:
- Long-Term
- Short-Term or Swing
- Intraday or day trading
Which one is the best?
It depends on your personality. Here is a summary of the characteristics of the three types to help you choose.
Long-Term
Long-term traders usually use daily or weekly charts. The weekly chart gives an overview and helps with entry decisions that are made on the basis of the shorter daily chart. Such positions usually remain from a few weeks to several months, sometimes even open for years.
Advantages
You don't have to constantly watch the market. Fewer transactions mean less spread pay.
Disadvantages
Larger fluctuations, which requires more far-reaching stops. Usually one or two good trades per year, that takes a lot of patience. A larger account is necessary to be able to survive longer fluctuations.
Short-Term
Short-term traders use hourly time frames and hold a position for several hours, sometimes up to a week.
Advantages
More opportunity for traders. There is no risk of losing months. You also often have the chance to make a good trade, not just a- or twice a year.
Disadvantages
Transaction costs are getting higher, as spreads are more frequent. Overnight risk should be considered.
Intraday or Day Trader
Intraday Traders Use Minute Charts (e.B. 1- or 5 minutes). Positions are kept short, before the market closes, all positions are closed.
Advantages
Lots of opportunities. You don't lose months. No overnight risk.
Disadvantages
Transaction costs are significantly higher, because there is often a spread. It requires a lot more concentration, because decisions have to be made much faster. Profits are often restricted because positions are closed at the end of the trading day.
Have you now been able to decide which Time Frame is the right one for you?
However, you should also consider how much capital you have available to trade. Shorter time frames allow for better use of levers (Leverage) and have tighter stop losses. For longer time frames, more capital is needed to survive fluctuations in the market without a margin call.
Have you decided on the Time Frame you prefer, then the fun can begin. Then start looking at different time frames to help analyze the market.
Long or Short?
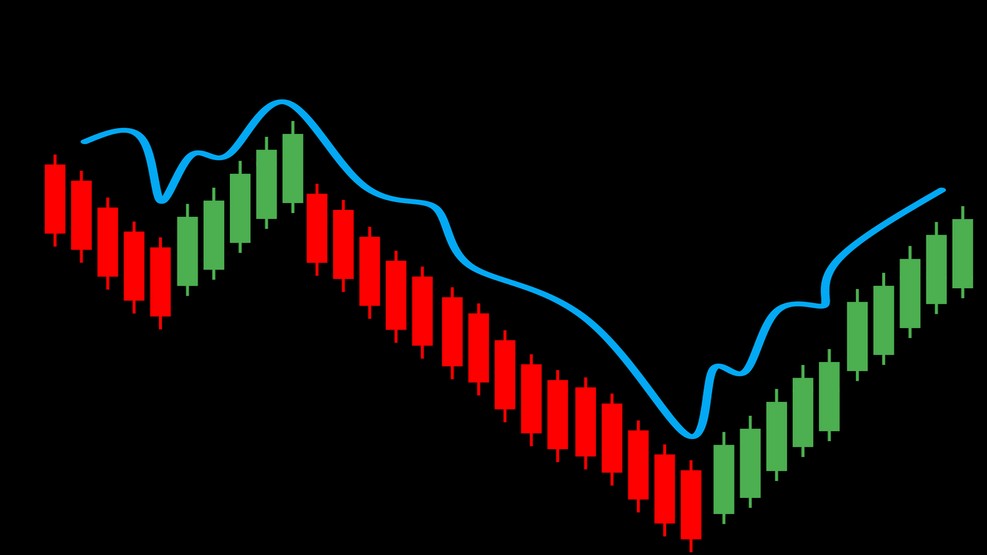
If you look at currency pairs in different time frames, you might find, that the market can move in different directions at the same time. A Moving Average Can Rise in a Weekly Chart, i.e. give a buy signal, but on the daily chart, thus providing a sell signal. On the hourly chart, the price rises and the 10-minute chart in turn brings a sell signal. What's going on?
Let's play a quick game, they say “Long or Short”. The rules are quite simple. You look at a chart and then decide whether to go long or short, So buy or sell. Easy. OK, ready?
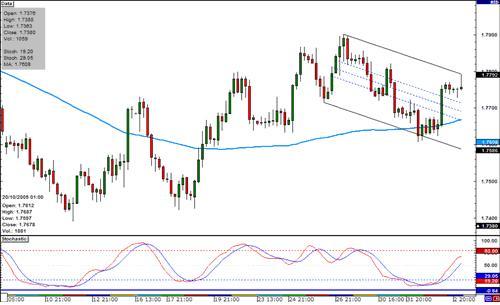
5-Minutes Chart
View the EUR/USD 5-minute chart. The price has just crossed the Simple Moving Average line, which is a clear buy signal and it has just broken out and closed above the previous resistance level. Perfect conditions for a long position, correct? I consider that yes.
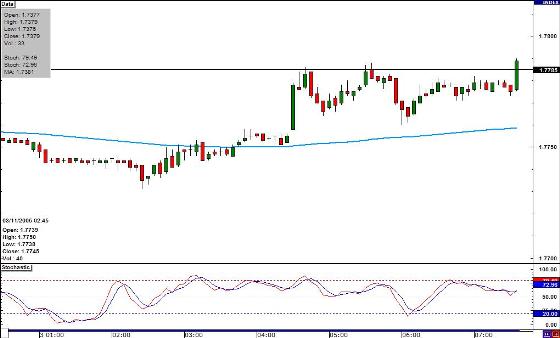
Oh! This decision was not right. See what happened next. The price has gone up a little bit, but then fell like a stone.
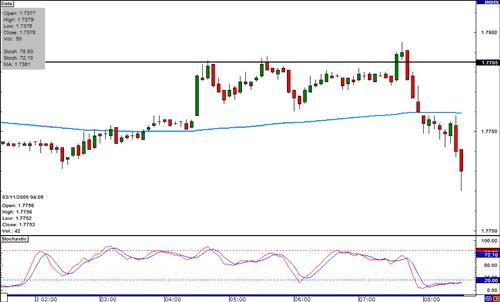
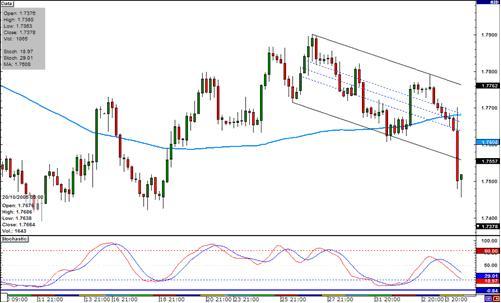
60-Minutes Chart
View the exact same chart with a larger time frame. Same day, the same time.
The pair has broken out of the downward channel, a buy signal. It's just above the Simple Moving Average, another buy signal. The last candle broke and closed above the previous resistance level, another buy signal. We're going to buy, that's right? OK.
Oh! Two to nil! The pair fell back into the old downward channel. Look at the last candle, It's sunk so much, that it almost doesn't have room on the chart anymore.
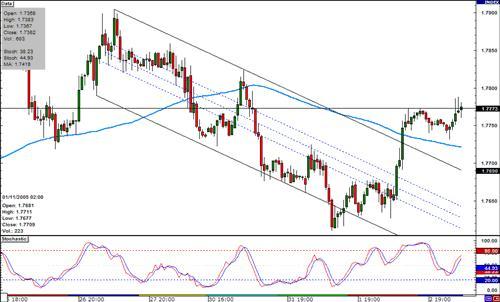
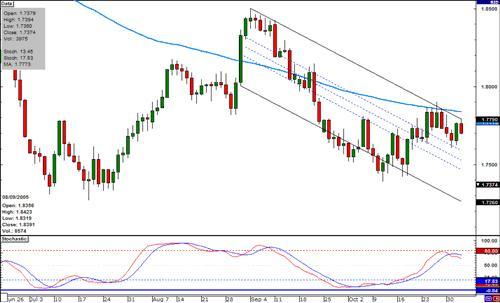
Hourly Chart
We are now at a chart with an even larger time frame, a 4-hour chart. Still the same day at the same time, only with a larger Time Frame. Had you seen this chart before, you would still have decided to take a long position on the 5-minute or 1-hour chart?
Now, we see that the currency pair is in a downward channel, a sell signal. Yes, the price is still above the Simple Moving Average line, which we can consider as a buy signal, But the channel makes me cautious. Especially since the price is at the upper trendline.
See What Happens! The couple actually stayed in the canal. After touching the upper trendline, it has fallen again.
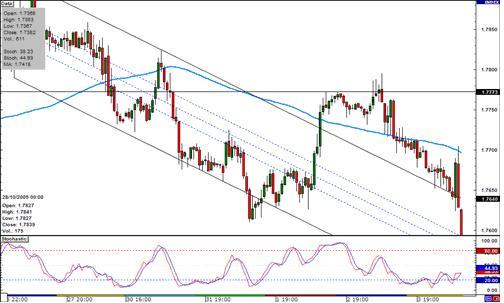
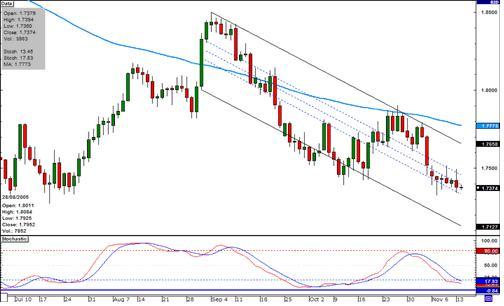
Daily Chart
Now let's zoom in on our time frame again and use a daily chart. Take a look at what's happening! The pair is in a clear downtrend. The price is below the Simple Moving Average line and is in a downward channel. On this chart, the trend is clearly visible. Have you also seen the last channel? The price touched the upper trendline, then fell again. You probably won't go long? Let's see what happened then.
You are right, the downward trend continues.
What do we learn from this??
All our charts are from the same day at the same time, only with different time frames. Now see how important it is to look at different time frames? They are used to trading exclusively on a 10-minute chart. They can't understand it, when everything in the market looks great for your trade and suddenly the price stops or there is a trend reversal. Have you ever thought of looking at the market with a larger time frame first to see what is happening? When the price stops or reverses on a 10-minute chart, Then it's often because of this, that he has reached a support or resistance level in a larger time frame.
It cost me several hundred euros to find out, the larger the time frame, the more important the support and resistance level. There is probably more money to be made when trading different time frames, than with any other technique alone. It allows you to keep positions open for longer, because you are able to determine where you are right now relative to the big picture.
Most beginners only look at a single time frame. You grab a frame, use your indicators and ignore all further time frames. The problem is that a new trend can be created from a larger time frame, mostly hurts those who don't know the bigger frame.
Look at what the market is doing right now. Don't get hung up on individual candles, but get an overview of what's going on in the market.
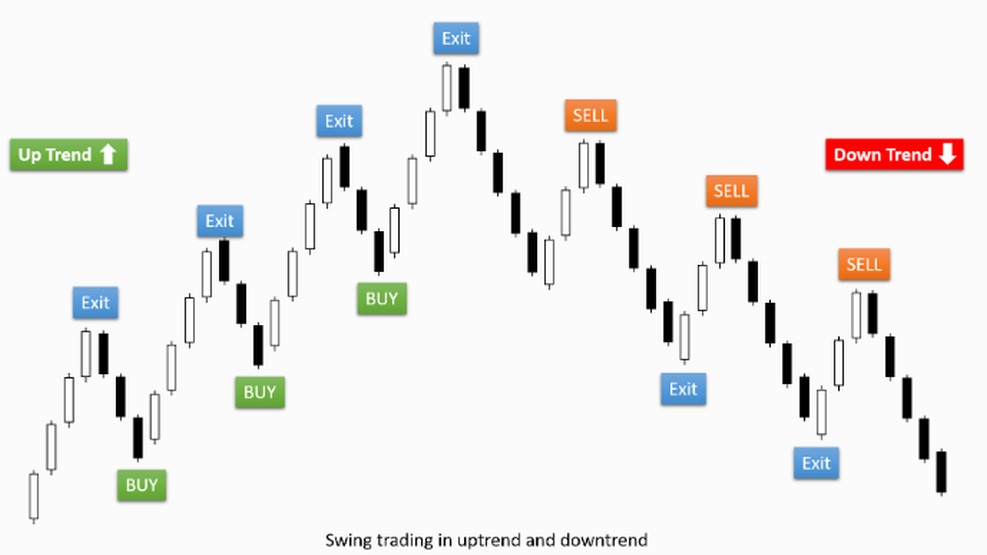
Select your preferred Time Frame and then move on to the next larger. You then make a strategic decision whether to buy or sell, based on the direction of the trend. After that, go back to your preferred frame to make tactical decisions about a- and exit (Define stops and profit targets).
There is also a limit to how many time frames you should study. You don't want a screen full of charts, each of which says something different. Use at least two, but no more than three different time frames, more would only confuse you and you would no longer be able to make decisions according to your time frame.
We recommend that you use three Time Frames. The biggest one will show you the main trend, the next shorter medium-term tends and the smallest time frame takes into account short-term trends.
You can use any Time Frame you want, as long as the time difference between the frames is large enough to see differences in their movements. Our suggestions:
- 1-Minute, 5-Minutes and 30 minutes
- 5-Minutes, 30-Minutes and 4 hours
- 15-Minutes, 1-Hour and 4 hours
- 1-Hour, 4-Hours and 1 day
- 4-Hours, 1-Day and 1 week, and so on.
When you're trying to decide how much time you want between frames, then you just need to make sure that the smaller time frame can move up and down without it having the same effect on the larger frame. If the time frames are too close together, you can't tell the difference, which makes the whole thing useless.
Summary of Time Frames
- First, you need to decide which is the right Time Frame (Time frame) for you is.
- If you have the preferred Time Frame, go to the next larger frame. This is where you make a strategic decision on whether to buy or sell, based on the direction of the trend. After that, you'll come back to your preferred Time Frame to make tactical decisions about it, where you can find a- and disembarking (Define stops and profit targets).
- Make it a habit to trade with multiple time frames.
- Select a set of Time Frames that you will observe, and focus only on those frames. Take Three Time Frames: 1-Hour, 4-Hours, 1-Day or 5 minutes, 15-Minutes and 1 hour, and so on. and then use only those three Time Frames. Find out what the market is doing in these frames.
- Don't bother with more than three Time Frames at a time, more would confuse you, as different frames mostly give different results.
- We can't repeat it often enough: Get an overview. The use of multiple time frames corrects discrepancies between indicators and individual time frames.
- Use a Long-Term Chart to Find the Trend, With the help of a short-term chart, you can then make decisions about a- and exit.
Congratulations
You have now completed primary school and are ready for high school.
Before that, we definitely recommend that you use the knowledge you have learned in a demo account.- and primary school to test and apply. Since you've already started 25 Be able to trade dollars, you should already take your first steps with real money, if you are sure, bet on the right currency.
- Best Forex MT4 & MT5 Indicators

- Best Trading Strategies
- Time To Next Bar Indikator

- Parabolic SAR MTF (Multi Time Frame)
")
- Accumulation/Distribution MTF (A/D)
")
- Math System Trader Indikator

- Force Index MTF (FI Multi Time Frame)
")
- Slow line

- Indicator Time Zones

- Custom Session Time Indicator

- Time Indikator

- Candle Closing Time Remaining

- Diamond Trader Binary Options…

- Relative Strength Index MTF (RSI)
")
- Stochastic Oszillator MTF

- The Classic Turtle Trader Indicator

- Pivot Custom 4 Time Frames…

- Momentum MTF (Multi Time Frame)
")
- Bollinger Bands MTF (BB) Indikator
 Indikator")
- Math Trader Ftv Signal Trading System

- Sefc Palato Trader Trading System

- Price Time Indicator
