We have now discussed several tools that help us analyze charts to identify trends. There is probably already too much information to work efficiently.
In this chapter we will deal with it, how to use the different indicators rationally. You will get to know the strengths and weaknesses of each tool, so that you are able to determine which indicator is best for you and your trading plan and which are out of the question.
Leading vs. Lagging indicators
We can choose between two different types of indicators: Leading (i.e. leading) and lagging (translates backwards).
The Leading Indicator gives us a buy signal before a new trend or trend reversal occurs. The lagging indicator, on the other hand, gives us the signal after a trend has formed.
You may think “I get rich if I stick to the leading indicators”, because you are able to benefit from new trends, that you always recognize in the early stages. Agrees, You always get the right time to jump on an emerging trend, if the leading indicator provides the right signals every time. Unfortunately, this is not the case.!
If you work with leading indicators, you will find that they often provide false signals. Leading indicators are known for this, that you generate false signals, that will mislead you.
Another possibility is lagging indicators (backward indicators) to use, these are significantly less susceptible to false signals. Disadvantage is, You're probably a little late to open a position. The strongest chamfer of a trend is usually at the very beginning, with lagging indicators you therefore often miss the section with the greatest profit and that annoys.
Oscillators and trend following indicators
For the purpose of this Chapter, let's divide technical indicators into two basic categories:
- Oscillators
- Trend following or momentum indicators
Oscillators are leading indicators, so indicators that give us a buy signal before the emergence of a trend. Trend following or momentum indicators are lagging indicators, which show us that a trend has already formed.
Although these two types can complement each other, you are more likely to contradict each other. We don't want to say that you should only use one or the other alone, However, you should know the potential dangers of both.
Oscillators – Leading indicators
An oscillator is an object or signal that moves between two points. In other words,, it is an element that is always between point A and point B.
Oscillators generally give a purchase- or sell signal, with the exception that the oscillator is not clearly on the purchase- or sales page. Does this sound familiar to you? Should it, Stochastic Oscillators, Parabolic SAR and the Relative Strength Index (RSI) fit right here. Each of these indicators is designed to receive signals, that predict reversal points during an ongoing trend.
Here are two examples:
In our chart USD/EUR we also have a Parabolic SAR Indicator, an RSI and a stochastic oscillator are displayed. As you already know, when the stochastic oscillator and RSI start the “Oversale- Level” to leave, this is a signal to buy. The indicators on our chart in the marked section bring exactly these signals. All three bring the same signal in this section, if we had bought, then this would have been a good trade.
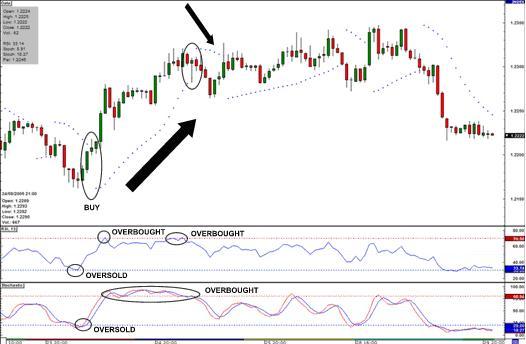
After the clear upward trend, we received a sell signal from all three indicators. As you can see, the Stochastic Oscillator has displayed overbought conditions over a longer period of time. When an oscillator displays an overbought or oversold level for an extended period of time, This usually means that it is a strong trend. In our example, a strong uptrend is underway while the stochastic oscillator indicates an overbought level.
In the next example, we use the same Leading Indicators, this time, however, they are not always of the same opinion and you can see that they are not always perfect. On our chart you can see that several false buy signals appear. You can also see that sometimes one indicator gives a buy signal, while the other displays a sell signal.
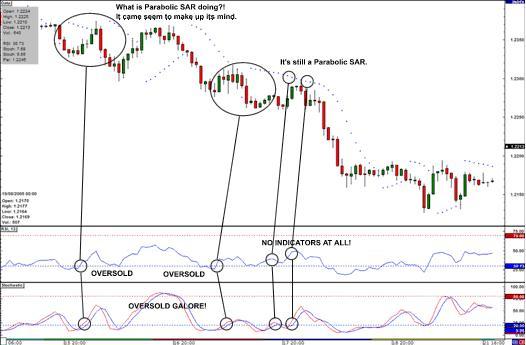
At the first mark, both RSI and the stochastic oscillator give a buy signal, while the Parabolic SAR still brings a sell signal. The Parabolic SAR remains on sale for a while, a little later, a dot under the bar jumps so a buy signal. Look at the bar under which the SAR point is located, it is a strong-looking red bar with a very short shadow. Furthermore, you should also note that the next bar below closes. Would you have relied on the indicators in this situation, then a less good trade would have come out of it.
The next two oversale signals (Buy) which the Stochastic Oscillator brings us, there is no signal at all in the RSI and the Parabolic SAR even gives a sell signal. What's going on? Each indicator gives a different Siganl.
What happened?
The answer lies in the different calculation methods. Stochastic indicators are based on the highest- to the lowest range of the corresponding time period (in our example hourly), but not from one hour to the next. Basis of the Relative Strength Index (RSI) are the closing prices of the periods. Parabolic SAR are calculated differently again, which again leads to further deviations.
This is how oscillators are, they assume that certain chart patterns always have the same effects for the future. But that's not true..
Although you need to be aware that leading indicators can be error-prone, there is no way around it. When you get different signals, then you better stay in an observational position, than trying to guess which signal is the right one. If a chart does not meet your personal criteria, if you do not place an order. Go to the next chart where your criteria fit.
Momentum – Lagging indicators
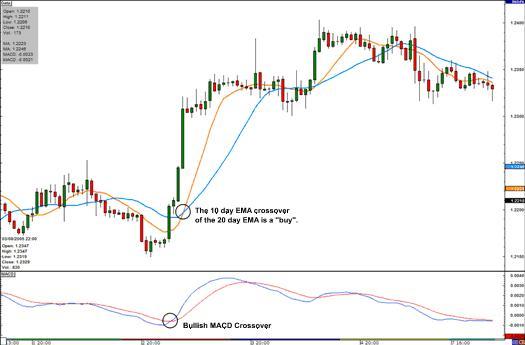
MACD and Moving Average are indicators that help us to identify trends. These indicators show us trends that already exist, The result is a delay. The beauty of it, Your chance of being right is quite high.
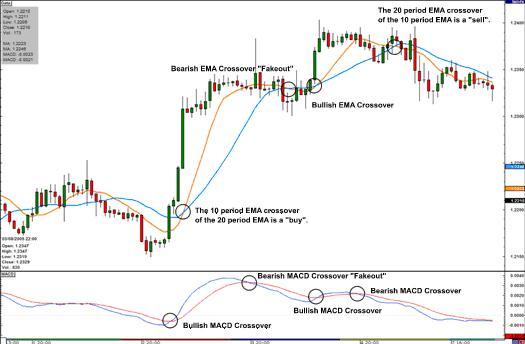
On our chart we see a bullish (Buy signal) MACD Crossover. A little later, the 10 Periods EMA line 20 Periods EMA line (also a buy signal). Both signals are correct, but if you had waited until both indicators bring a buy signal, then you would have missed a strong price movement.
Now let's look at the same chart, to see that these indicators sometimes also bring wrong signals. We refer to them as “Fake-Out”.
We get a bearish crossover from the MACD after the upward trend (Sell signal). Much later, the 20 Periods EMA line below the 10 EMA Line (also sell signal). As you can see, the price has not gone down, but moved sideways and then even continued the upward trend. For a while, both indicators have provided a sell signal. Would you have a short order (Sale) executed, then you would not have been right this time.
Summary Of Leading and Lagging Indicators
The 1 Million Euro Question.
How should I decide if I want oscillators, Trend should use the following indicators or maybe even both? As we have already found out, they do not always give the same signals. This is probably the biggest challenge in technical analysis. You should know, that you first need to know the market in which you are trading, from this you can then recognize which indicator provides you with the right signals and which are currently not suitable. A little more on this in a later chapter.
There are two types of indicators – Leading and Lagging:
- A leading indicator gives a signal before a trend or trend change occurs.
- A lagging indicator only brings its signal after a trend has begun.
- Technical indicators can be divided into two categories: Oscillators and trend following or momentum indicators.
- Oscillators are leading indicators.
- Momentum indicators are lagging indicators.
- If you are able to analyze the market in which you trade, then you are able to decide which indicator brings the right signals and which should not be used at the moment.
- Best Forex MT4 & MT5 Indicators

- Best Trading Strategies
- Silver Trend Indicator

- Gann Swings Indicator

- Internal Bar Strength

- Best Forex Indicators for MT4 and MT5

- Octaves Indikator

- Scalping Trading Indikatoren…

- Grf Leading Edge Indicator

- Sniper Momentum Scalping Trading System

- Linear Momentum Indicator

- Momentum Filter Bollinger Bands…

- MACD Momentum Indicator

- Float Pivot Indicator

- Combinations of Japanese candles

- MATWO Indicators

- Trand Indicator

- Squeak Stochastic

- Spectrometr Indicator

- Ima Min Trends Indicator

- Chande Momentum Oscillator…

- UFX Indicators
