Candlestick Pattern

Candlestick Pattern

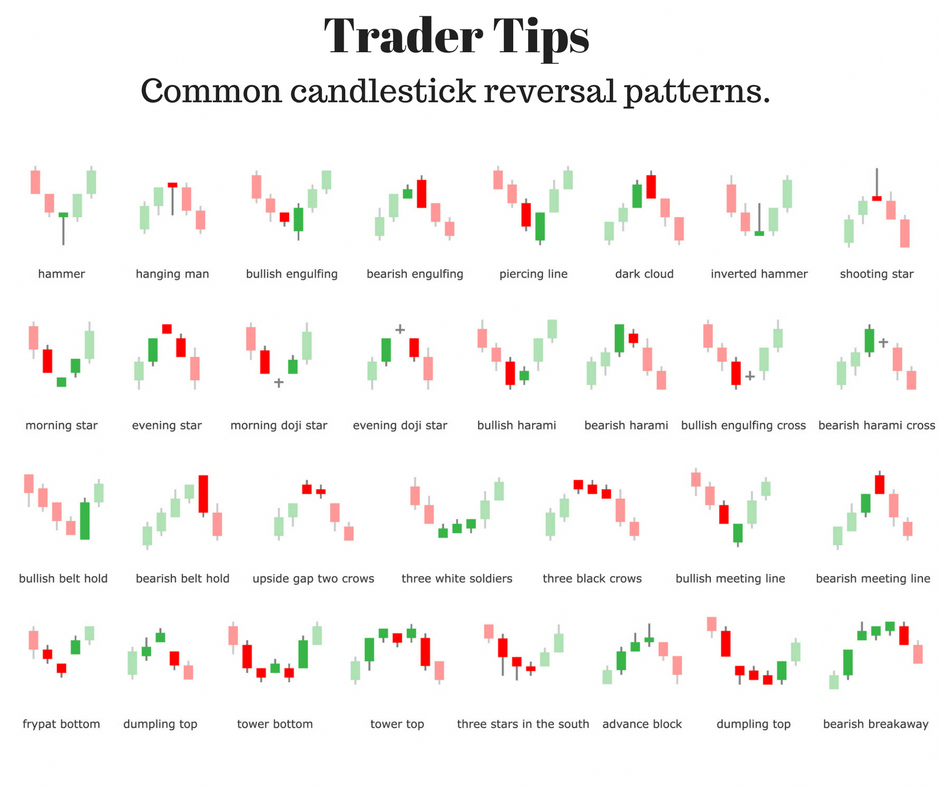
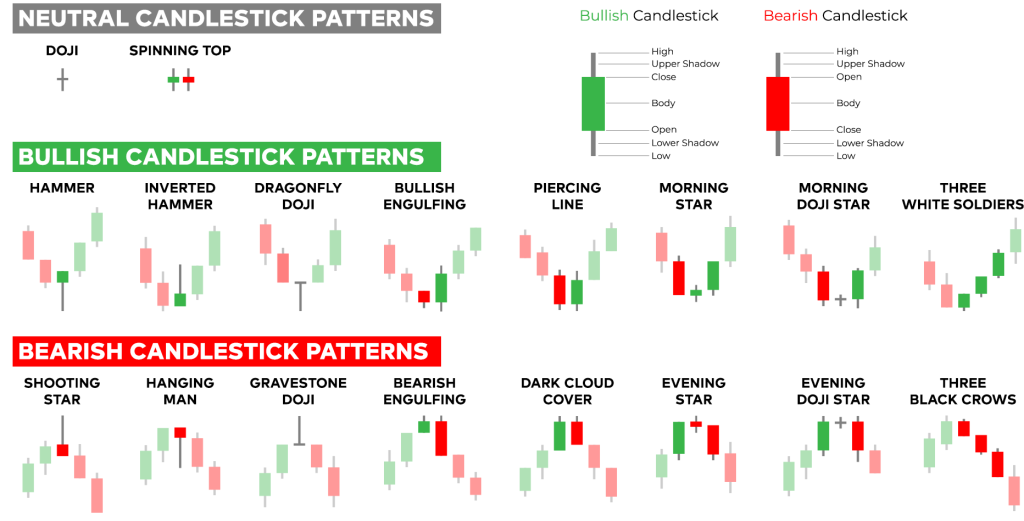
In the previous chapter, we briefly addressed the topic of candlesticks, now we will take a closer look at what candlesticks are and how you can use them for your activity as a FOREX trader. Candlesticks are originally from Japan, Steve Nison then discovered this technique for use in trade statistics..

Support and Resistance

Support (Support) and Resistance (Resistance) is one of the most widely used concepts of FOREX chart analysis. The stranger it seems, that everyone has a different idea of it, when support or resistance occurs. Let's look at a diagram in which both situations are drawn.

Support and Resistance

In this chart we see that the price is basically in an upward trend (Bull market) is located, but there is also a tick – Zack patterns to recognize. When the price rises and then is pulled down, then we refer to the highest point previously reached as Resistance.

Moving Average

A Moving Average, on German moving average, is a method of smoothing price movements in a certain period of time. The Moving Average calculates an average of the last closing prices of a certain number of trading sections.

Moving Average

Like any other indicator, we also use the moving average to help anticipate future price movements. If you look at the slope of the mean, then they can take a picture of it, where the price will continue to move.

Oscillators and Momentum Indicators

Oscillators and Momentum Indicators

We have now discussed several tools that help us analyze charts to identify trends. There is probably already too much information to work efficiently.

In this chapter we will deal with it, how to use the different indicators rationally. You will get to know the strengths and weaknesses of each tool, so that you are able to determine which indicator is best for you and your trading plan and which are out of the question.

Chart Pattern

Chart Pattern

Meanwhile, there are already some tools in your FOREX- Toolbox. In this chapter we will add one more: Chart Pattern!

Let's compare chart patterns with a mine detector, if you have understood this chapter, you will be able to “Price explosion” to be recognized before it takes place. You will make a lot of money with it.